UK advertising expenditure grew 3.7% to reach GBP 21.4bn in 2016, the seventh consecutive year of market growth, according to the Advertising Association/WARC Expenditure Report – the UK’s definitive advertising statistics.
Growth in UK adspend held steady in Q3 after the June referendum, before reaching £5.8bn in Q4 2016, a rise of 3.9% year-on-year and the highest grossing quarter on record. In real terms, after accounting for inflation, UK adspend topped its pre-recession peak for the first time during both the final quarter and for 2016 as a whole. Forecasts for the next two years indicate continued growth of 2.5% in 2017 and 3.3% in 2018.
Stephen Woodford, Chief Executive at the Advertising Association told us “Advertising has proved resilient to uncertainty and behind these numbers is a cutting edge, digital business in which Britain is a world-beater. As we work towards Brexit, we’re urging Government to support UK advertising and do more to unlock its potential to grow UK plc.”
Digital formats continued to drive growth in 2016, with internet adspend up by 13.4% to £10.3bn, with mobile accounting for 99% of that growth. Mobile spend reached £3.9bn, with 86% of the current value of the mobile advertising market generated in just the past five years.
Digital accounted for 38% of the £1.1bn out of home advertising market in 2016, double the share digital recorded in 2012, while revenues from online ads were up for national newsbrands (+4.9% to £230m) for the fifth year running.
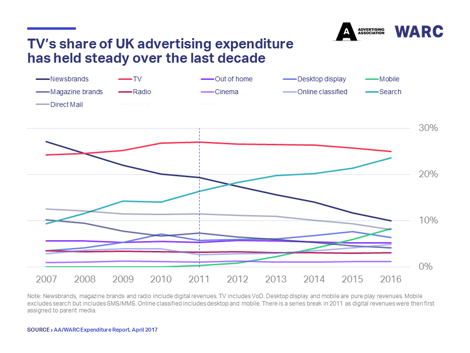
TV adspend, boosted by 12.6% growth in video-on-demand revenue, recorded a new high of £5.3bn in 2016, with TV’s share of overall spend holding steady at 25% over the last decade. Annual growth in adspend was also recorded for cinema (+8% to £257m) and radio (+5.4% to £646m) in 2016.
James McDonald, Senior Data Analyst at WARC was quoted as saying “The UK’s ad industry is experiencing the most seismic shift since WARC began monitoring in 1982. Last year exemplified this, as over 95% of the money entering the market came from digital formats. The trend will continue as ad tech improves and consumers spend more time with their internet-connected devices.”
The Advertising Association/WARC Expenditure Report is the definitive measure of advertising activity in the UK. It is the only source that uses advertising expenditure gathered from across the entire media landscape, rather than relying solely on estimated or modelled data. With total market and individual media data available quarterly from 1982, it is the most reliable picture of the industry and is widely used by advertisers, agencies, media owners and analysts.
|
|
Adspend 2016 (£m) | 2016 v 2015 | Forecast 2017 | Forecast 2018 |
| % change | % change | % change | ||
| Internet | 10,304 | 13.4% | 8.5% | 7.6% |
| of which mobile | 3,866 | 45.4% | 30.4% | 20.8% |
| TV | 5,277 | 0.2% | -0.5% | 3.0% |
| of which spot advertising | 4,730 | -0.5% | -1.4% | 2.4% |
| of which broadcaster VoD | 197 | 12.6% | 13.7% | 11.0% |
| Direct Mail | 1,713 | -10.4% | -7.5% | -6.0% |
| Out of Home | 1,106 | 4.5% | 3.4% | 2.3% |
| National newsbrands | 1,101 | -10.0% | -7.4% | -7.2% |
| of which digital | 230 | 4.9% | 1.9% | 1.4% |
| Regional newsbrands | 1,021 | -13.2% | -8.6% | -8.3% |
| of which digital | 193 | -3.4% | 0.2% | 1.0% |
| Magazine brands | 877 | -6.8% | -5.1% | -4.6% |
| of which digital | 282 | 0.2% | 3.3% | 3.7% |
| Radio | 646 | 5.4% | 3.3% | 2.6% |
| of which digital | 28 | 35.0% | 21.3% | 18.7% |
| Cinema | 257 | 8.0% | 5.3% | 3.6% |
| TOTAL UK ADSPEND | 21,372 | 3.7% | 2.5% | 3.3% |
| Percentage point change to forecast since January shown in brackets. Broadcaster VoD, digital revenues for newsbrands and magazine brands, radio station websites and mobile advertising spend are also included within the internet total of £10,304m, so care should be taken to avoid double counting. Mobile includes tablet. | ||||
| Source: AA/WARC Expenditure Report, April 2017. | ||||
At-a-glance media summary, Q4 2016
- Internet adspend rose 15.3% during Q4 2016, pushing the full-year total above £10bn for the first time. Mobile accounted for 99% of the new money entering the internet ad market last year.
- Television adspend dipped 2.1% in the final quarter of 2016, though this was counter-balanced by rises earlier in the year, resulting in 0.2% growth for 2016 as a whole. Total TV spend is expected to dip this year, before the losses are regained in 2018.
- Radio adspend rose 7.7% to a record-high level during the last three months of 2016, buoyed by the strongest growth in spot revenue since Q4 2014. Other than internet, radio was the only medium to gain share of total adspend in 2016 (+0.1pp vs. 2015).
- Out of home (OOH) spend grew by 2.0% year-on-year during the final three months of 2016, supported by a 22.7% rise in digital ad expenditure. Full-year adspend rose for the sixth consecutive year in 2016, and further sector growth is forecast this year and next.
- National Newsbrands’ combined ad revenues fell 9.0% during Q4 2016. The 10.0% dip recorded during 2016 as a whole was, however, £25m softer than the loss recorded in 2015. The rate of decline is expected to ease further over the forecast period.
- Regional Newsbrands’ ad income dropped across print (-16.7%) and digital (-1.1%) formats in the final quarter of 2016, with combined full-year revenues down 13.2%. As with national newsbrands, the rate of decline is forecast to soften over the coming years.
- Magazine brands recorded losses in income from both print (-9.1%) and digital (-5.7%) ads in Q4, though full-year digital revenues rose 0.2% thanks to growth among publishers of consumer titles.
- Cinema adspend grew for the third consecutive year in 2016, topping 2015’s peak by 8.0% to reach £257m. The full-year total was boosted by the highest quarterly spend on record during Q4.
- Direct Mail adspend was down 9.2% in Q4 2016, and full-year spend was 10.4% lower than in 2015. As with other printed formats, the severity of annual dips in ad revenue is expected to ease.