Andrew Neale
Repeatedly now, our sister site aka.tv has shown that twitter traffic for big shows this year has been falling: #CES2017 (detailed here) and #ISE2017 (detailed here) were both 10% down on the previous year. It was also the first year that neither show saw a year-on-year increase in twitter traffic.
At #CES2017 the headline number of tweets was down whereas the other totals were up: impressions up 15%, users tweeting up 9%, and users reached up 26%; at #ISE2017 the headline number of tweets was down, impressions were down, users tweeting was only up by 401 users (bearing in mind that the actual show attendance increased by 8,000 or so to 73,413).
This year for #InfoComm17 all the numbers were down.
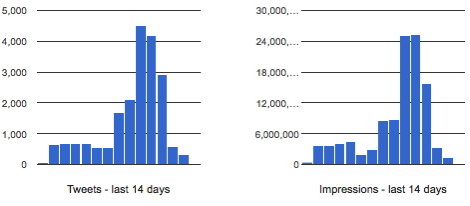
Here’s our final #InfoComm17 twitter analysis for the last 30 days: –
No. of Tweets: 23,064 (down 46.8% from 2016)
No. of Twitter impressions: 122,513,287 (down 22.9% from 2016)
No. of Twitter users who tweeted: 4,068 (down 28.3% from 2016)
No. of Twitter users reached: 8,883,412 (down 58.7% from 2016)
Highest number of tweets per hour was 406 – achieved at 09:00 on the opening day of the show, Wednesday June 15, 2017.
For comparison here are the #InfoComm16 totals at a glance: –
No. of Tweets: 33,852
No. of Twitter impressions: 150,640,460
No. of Twitter users who tweeted: 5,219
No. of Twitter users reached: 14,096,734
Highest number of tweets per hour was 679
Top Ten:
|
|
| No |
Name |
Impressions |
| 1 |
@rAVePubs |
42,008,505 |
| 2 |
@evankirstel |
6,802,172 |
| 3 |
@DailyDOOH |
6,375,275 |
| 4 |
@Crestron |
3,291,988 |
| 5 |
@Polycom |
2,916,412 |
| 6 |
@SamsungBizUSA |
2,531,478 |
| 7 |
@chris_neto |
2,486,812 |
| 8 |
@AVMag |
1,904,631 |
| 9 |
@CiscoCollab |
1,784,201 |
| 10 |
@avtweeps RT bot |
1,453,425 |
|
Trending:
|
|
Most Listed Users
| No |
Name |
No of Lists |
| 1 |
@ArkangelScrap |
21,519 |
| 2 |
@roomeezon RT bot |
19,084 |
| 3 |
@StartUpRealTime |
18,867 |
| 4 |
@WalesBuzz |
14,245 |
| 5 |
@itknowingness |
14,208 |
| 6 |
@biconnections |
13,702 |
| 7 |
@bot_innovation RT bot |
12,873 |
| 8 |
@evankirstel |
12,859 |
| 9 |
@BuzzSaffa |
8,885 |
| 10 |
@TrippBraden |
8,301 |
|
By Date:
| Date |
Tweets |
| 2017-06-19 Mon |
12 |
| 2017-06-18 Sun |
331 |
| 2017-06-17 Sat |
577 |
| 2017-06-16 Fri |
2934 |
| 2017-06-15 Thu |
4175 |
| 2017-06-14 Wed |
4519 |
| 2017-06-13 Tue |
2116 |
| 2017-06-12 Mon |
1703 |
| 2017-06-11 Sun |
537 |
| 2017-06-10 Sat |
543 |
| 2017-06-09 Fri |
687 |
| 2017-06-08 Thu |
687 |
| 2017-06-07 Wed |
686 |
| 2017-06-06 Tue |
651 |
| 2017-06-05 Mon |
489 |
| 2017-06-04 Sun |
79 |
| 2017-06-03 Sat |
98 |
| 2017-06-02 Fri |
299 |
| 2017-06-01 Thu |
347 |
| 2017-05-31 Wed |
358 |
| 2017-05-30 Tue |
194 |
| 2017-05-29 Mon |
62 |
| 2017-05-28 Sun |
30 |
| 2017-05-27 Sat |
86 |
| 2017-05-26 Fri |
185 |
| 2017-05-25 Thu |
184 |
| 2017-05-24 Wed |
200 |
| 2017-05-23 Tue |
164 |
| 2017-05-22 Mon |
78 |
| 2017-05-21 Sun |
33 |
| 2017-05-20 Sat |
20 |
|
| Date |
Impressions |
| 2017-06-19 Mon |
126,121 |
| 2017-06-18 Sun |
1,430,189 |
| 2017-06-17 Sat |
3,377,845 |
| 2017-06-16 Fri |
15,809,204 |
| 2017-06-15 Thu |
25,245,843 |
| 2017-06-14 Wed |
25,178,978 |
| 2017-06-13 Tue |
8,737,478 |
| 2017-06-12 Mon |
8,591,350 |
| 2017-06-11 Sun |
2,950,415 |
| 2017-06-10 Sat |
1,919,926 |
| 2017-06-09 Fri |
4,500,991 |
| 2017-06-08 Thu |
4,045,902 |
| 2017-06-07 Wed |
3,622,478 |
| 2017-06-06 Tue |
3,689,827 |
| 2017-06-05 Mon |
2,959,079 |
| 2017-06-04 Sun |
238,046 |
| 2017-06-03 Sat |
386,369 |
| 2017-06-02 Fri |
1,044,384 |
| 2017-06-01 Thu |
1,717,398 |
| 2017-05-31 Wed |
1,790,614 |
| 2017-05-30 Tue |
647,249 |
| 2017-05-29 Mon |
189,795 |
| 2017-05-28 Sun |
455,029 |
| 2017-05-27 Sat |
282,291 |
| 2017-05-26 Fri |
713,572 |
| 2017-05-25 Thu |
976,652 |
| 2017-05-24 Wed |
810,390 |
| 2017-05-23 Tue |
594,818 |
| 2017-05-22 Mon |
253,861 |
| 2017-05-21 Sun |
161,142 |
| 2017-05-20 Sat |
66,051 |
|
Displaying results at: 2017-06-19 03:00 in EDT time zone (BST -5 hours)
You can see the analysis in more detail here.
This entry was posted
on Monday, June 19th, 2017 at 08:26 @393
and is filed under Scuttlebut.
You can follow any responses to this entry through the RSS 2.0 feed.
You can leave a response, or trackback from your own site.

Follow DailyDOOH