Here is COMMB’s second report on travel and activity levels to destinations by week, including Retail & Rec, Transit and Workplaces (offices). COMMB sourced mobility data from mapping software and mobile device data for this report.
Data, tracking consumer movements, shows increased activity since the beginning of June, with numbers leveling off in July. With most provinces in phase 3 of re-opening businesses and travel behaviour patterns close to pre-pandemic norms, data is reflecting a return to normalcy.
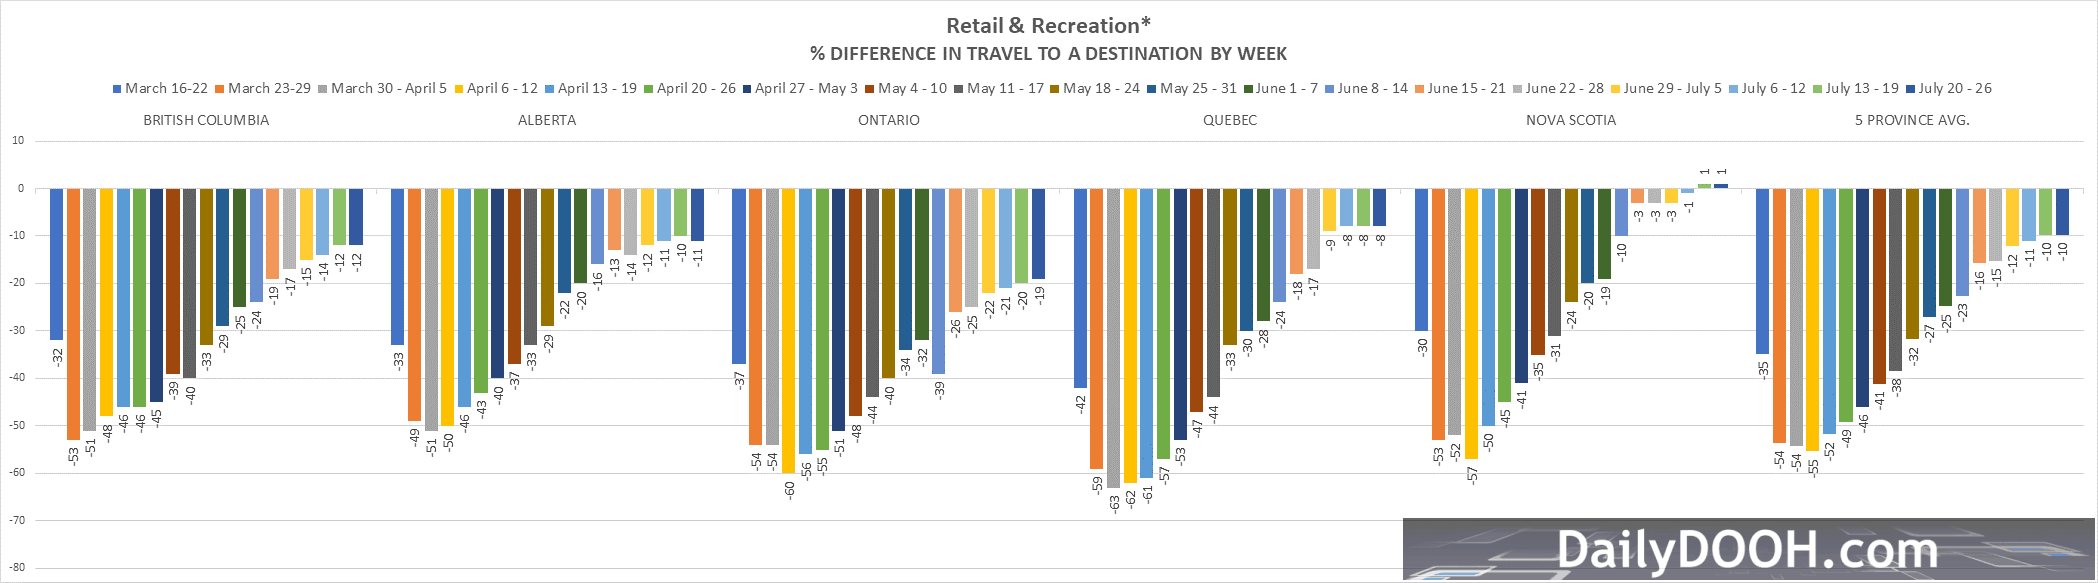
Visitation to Retail and Recreational venues across the 5 provinces was up 15 percentage points to -10%, since June 1st. Quebec increased 20-percentage points to -8% below baseline followed by Ontario up 13 points to -19%, British Columbia up 13 points to -12% and Alberta up 9 points to -11%, for the same time period. Nova Scotia is back to normal activity at +1 above norms.
 [1]
[1]
Additional mobile device ID data, captured from a sample of polygoned resto-bar venues, shows a similar trend. Alberta (80 venues sampled) showed an increase of 12% in traffic to resto-bar locations and British Columbia (94 venues samples) showed an increase of 3% from mid-June to mid-July (June 15-21 to July 6-12), when comparing 2019 to 2020.
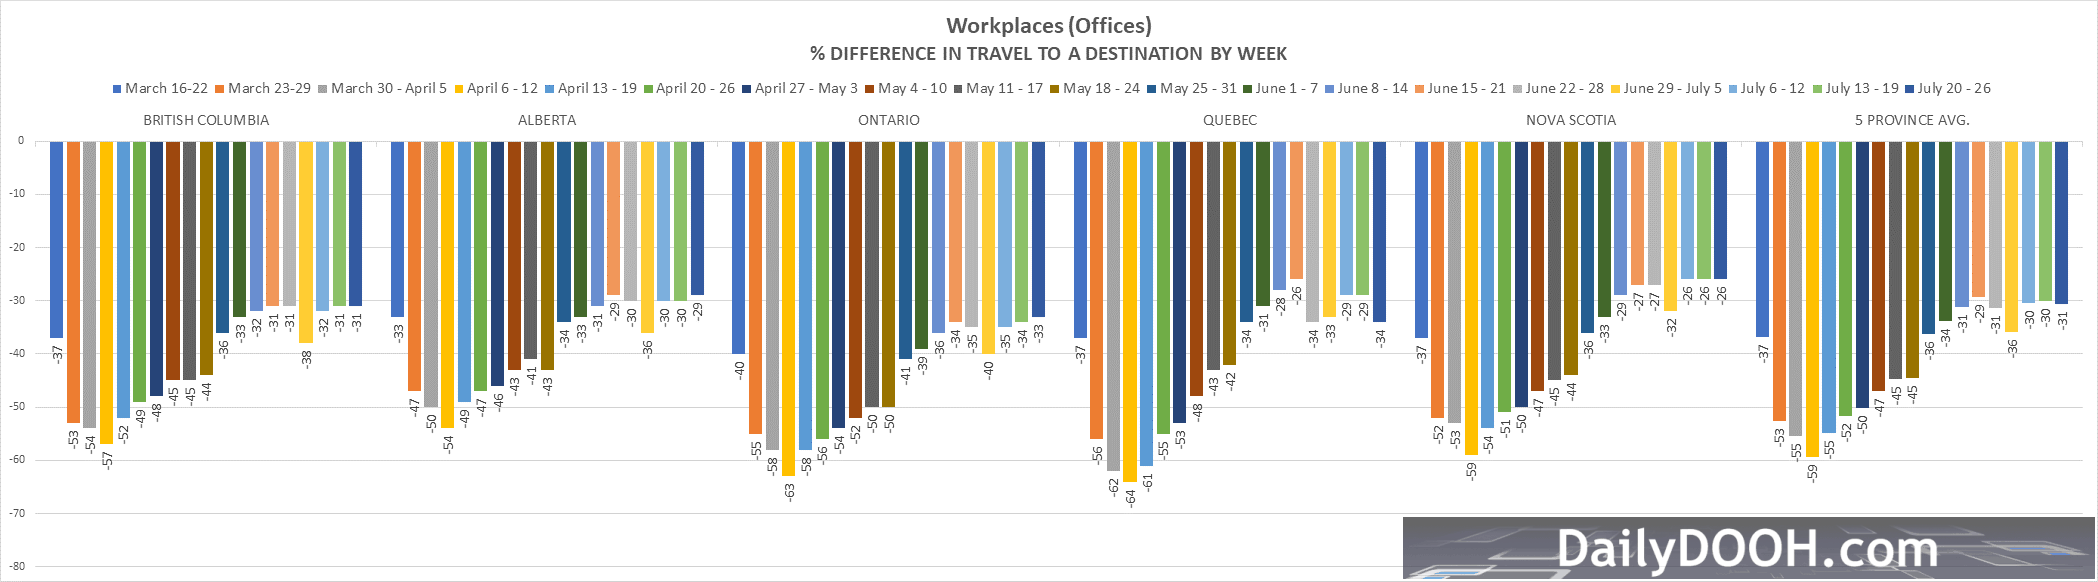
Workplaces had the least amount of variation with the 5-province average up 3-percentage points to -31, since June 1st. Nova Scotia was up 7-percentage points to -26% below baselines, Ontario up 6 points to -33%, Alberta up 4 points to -29% and British Columbia up 2 points to -31%. Quebec went down 3 points to -34% below baseline numbers.
 [2]
[2]
Additional mobile device ID data, captured from a sample of polygoned resto-bar venues, shows a similar trend. Alberta (80 venues sampled) showed an increase of 12% in traffic to resto-bar locations and British Columbia (94 venues samples) showed an increase of 3% from mid-June to mid-July (June 15-21 to July 6-12), when comparing 2019 to 2020.
Workplaces had the least amount of variation with the 5-province average up 3-percentage points to -31, since June 1, 2020. Nova Scotia was up 7-percentage points to -26% below baselines, Ontario up 6 points to -33%, Alberta up 4 points to -29% and British Columbia up 2 points to -31%. Quebec went down 3 points to -34% below baseline numbers.
![]() [3]
[3]
Data over a five week period starting January 3rd to February 6th was used as a baseline to calculate the % difference by week, for the three graphs above. The sample used in this data is based on devices with opted in location history settings on their devices.