Recently, Nielsen released its Fourth Screen Network Audience Report [1]. One quote caught my attention, stating that Nielsen “confirmed the clear acceleration of monthly traffic in malls during the fourth quarter.”
Unfortunately, I was unable to secure a copy of this report. But the message Nielsen is sending is clear – mall traffic is increasing.
This message/reported fact got me thinking that with the retail industry in such state of flux, how could it be that mall traffic is actually increasing? So I set about to find various data points that either support or conflict with this Nielsen finding.
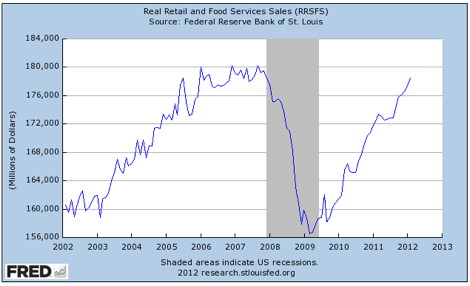
February 2012 retail sales, for example, rose by a robust 1.1 percent versus January, and 6.5 percent versus February 2011. But as Chart 1 illustrates, real retail sales have not yet returned to pre-recession levels.
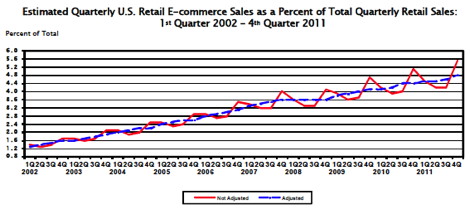
Also, e-commerce retail sales continue to grow. Total e-commerce sales for 2011 were $194.3 billion, an increase of 16.1 percent from 2010. E-commerce sales in 2011 accounted for 4.6 percent of total retail sales (see Chart 2). Is it farfetched to think that this would result in fewer trips to the mall?
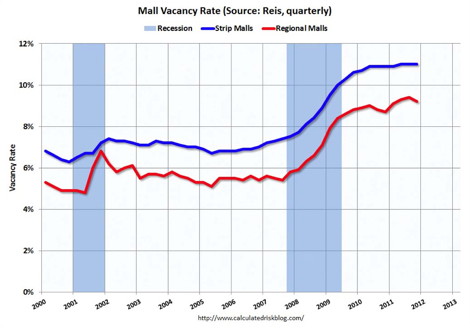
According to real estate research firm Reis Inc., the average vacancy rate at malls in the top 80 U.S. markets was 9.2 percent in the fourth quarter of 2011, a slight improvement versus the 9.4 percent in the third quarter, an 11-year high (see Chart 3). Cassidy Turley, another retail real estate firm, estimates that the fourth quarter 2011 vacancy rate at malls was 11.0 percent, the same as the fourth quarter of 2010.
Cassidy Turley, in its February 2012 U.S. Retail Report notes, however, that the market is actually stronger than it appears, in that leasing was the strongest since 2007. They cite the bankruptcies of retailers such as Blockbuster, Borders, etc. that returned 15 million square feet of retail space to the market. While it may be the case that an excessive amount of retail real estate was returned to the market in 2011, this trend is not over. Other retailers will go broke in 2012, and some, like Best Buy, Gap and Sears, etc. will continue to return retail space to the market.
Finally, consider the anemic state of mall construction. According to ChainLinks Retail Advisors U.S. National Retail Report 2012 Forecast, 13 million square feet of new shopping center construction was added during 2011. To put this in perspective, the Report notes, “At the peak of the last real estate cycle (2004 to 2007), deliveries averaged over 10 times this total, or 135 million square feet per year.
We are tracking just under 12 million square feet of shopping center space currently under construction throughout the United States, the lowest amount that we have ever tracked.”
In closing, I readily admit that I am not a mall traffic-counting expert like Nielsen. Nor do I get paid to produce such studies. But various microeconomic trends cause me to have a gut level response that questions Nielsen’s findings. Perhaps next quarter, Nielsen will make available its First Quarter Fourth Screen Network Audience Report to me, so that I can learn the error of my ways.


3 Comments To "PRI Questions Nielsen’s Recent Mall Traffic Data"
#1 Comment By Mike MacMillan On 12 April 2012 @ 13:16 @594
Check it against shoppertrak’s index they are considerered the mall traffic index of any standing in the IS
#2 Comment By Bill Ketcham On 12 April 2012 @ 17:34 @773
The recent release (which was ours, not Nielsen’s), showed that mall traffic indeed accelerates in the fourth quarter versus the baseline of the first nine months of the year. This is not news to anyone in the industry, as holiday shopping always bumps mall traffic in the fourth quarter. But this is the first time a third party source (Nielsen) has shown the seasonal trend to the media community. What makes it interesting is that Nielsen’s 4th Screen gross impressions in the mall space are driven by their access to raw Scarborough traffic, so we can look at monthly gross impressions in our pocket pieces. This showed December gross impressions to be about 50% higher than the baseline of the first nine months of the year. Nothing in the release addressed longer term mall traffic trends, which vary significantly by type of mall. In the large, upscale malls in the Adspace Digital Mall Network or Mallvision 360, the overall trend is very slightly up, with shorter term variations driven by the economy.
#3 Comment By Steven Keith Platt On 13 April 2012 @ 01:33 @106
I appreciate Bill’s comments (Bill Ketcham, Executive VP and Chief Marketing Officer/Adspace Networks), and recognize that a bit of miscommunication occurred. First, I mistakenly referenced Nielsen’s Fourth Screen Report, for which I apologize. My blog entry was developed after reading the Adspace Network news release.
I keyed in on a specific quote that referenced “the clear acceleration of monthly traffic in malls during the fourth quarter.” I took that to mean all malls, not select or some malls, which I thought was an overstatement. My tongue-in-cheek response led me to question the findings.
While I now better understand more specifics about the study and the results stated in the Adspace news release, I am still of the view that macroeconomic indicators would tend to indicate that traffic in some malls may be down, while it is not in others.