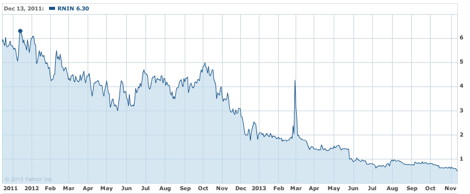
We won’t predict Wireless Ronin’s eventual demise here (we’ve done that a few times before and every time, somehow they have managed to cling on and survive) but their two year historical stock price chart makes interesting reading…
 [1]
[1]
That spike in March 2013 was the Samsung SoC announcement [2] and how that was managed / manipulated AND did not result in people going to jail is still beyond me.
They are currently trading at less than 50 cents a share, with a market cap below USD 3M and as Sixeteen:Nine’s Dave Haynes says (here) [3] “Total operating expenses are more than what the company has on hand, and is roughly equal to what Ronin loses per quarter these days”.