Our sister site aka.tv [1] has been displaying twitter traffic analysis for the hashtag #ISE2014 for a couple of months now, and as you can see from the graphs below (screen grabbed from the site itself) we’ve started to make some improvements – especially with the way the collected data is displayed.
 [1]
[1]
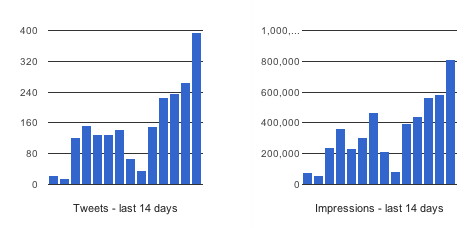
On the left is a graph showing the number of tweets per day that used the hashtag #ISE2014 – you can clearly see the weekend (it starts Sat, Sun, Mon, etc as you would expect) and then the usual increase of twitter traffic as the week progresses.
This last week saw a big spike in traffic compared to the previous week, traffic for the event is really starting to build now with the most recent Friday seeing 395 tweets, but building up to that was Tuesday, Wednesday and Thursday: 227, 236 and 266.
The graph on the right shows the number of impressions per day. Also on the site we indicate the No. of Twitter users reached, which last week was 878,971.
Last year’s event in Amsterdam saw twitter traffic double compared to 2012 (and the total impressions almost tripled).
If you need reminding, our #ISE2013 Hashtag Analysis can be found here [2].