Adrian J Cotterill, Editor-in-Chief
“Historically, Geopath impressions were used as a forecasting metric in order to predict the audience delivery of an out-of-home campaign. They were not intended to provide insights into a campaign’s performance mid-campaign, nor did they signal the final goal and subsequent end of an OOH campaign, as often occurs in other media” so says Geopath’s Scott Fiaschetti.
 OOH advertising has always been planned and bought on a variety of factors, including location, format type, and number of units over a specific contract term.
Scott Fiaschetti said “Geopath impressions are another point of differentiation that provide guidance on inventory selection – but impressions are only part of the equation. We recognize that unprecedented times require unprecedented solutions”.
When the COVID-19 pandemic began to impact traffic patterns, Geopath, their partners at Intermx, and their Insights Committee instantly pivoted their work to focus on real-time travel data and the curation of real-time impression adjustments.
In response to the anomalous traffic patterns impacting North America, Geopath is releasing two new data solutions, a Real-Time Travel Activity Dashboard and Real-Time Impression Adjustment Metrics.
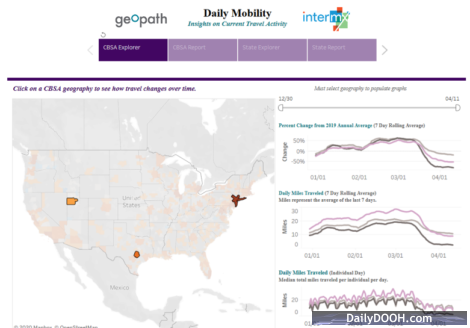
- Real-Time Travel Activity Dashboard
(Available now by clicking here) - Real-Time Impression Adjustment Metrics
(Pending Release 1-2 Weeks)
In order to help the entire OOH industry, the Real-Time Travel Activity Dashboard is being made available for free, regardless of Geopath membership status. Cleverly, Geopath is leveraging mobile location data from multiple background SDK providers to determine the average distance traveled by a representative panel within each market. Mobile location data is analyzed across multiple days of the week and hours of the day to accurately calculate distance traveled as the population moves throughout the market. Distance traveled is reported as the median miles traveled every day, the rolling average of the median distance over seven days, and the rolling average over seven days as a percentage difference compared to the cumulative 2019 average daily distance traveled.
Geopath President Kym Frank said “We realize that these data present new challenges for our industry, but transparency is crucial to ensure that we are being the best partners to advertisers, and that we retain our positive reputation in the advertising ecosystem”
Geopath are hosting two workshops this week to discuss how to use the dashboard, and to provide guidance on use of these metrics, as follows: –
They have also stated that they will share detailed information on the data and methodology behind the adjusted impressions. If you have immediate questions, you can reach out to their team at geekOUT@geopath.org.

Follow DailyDOOH